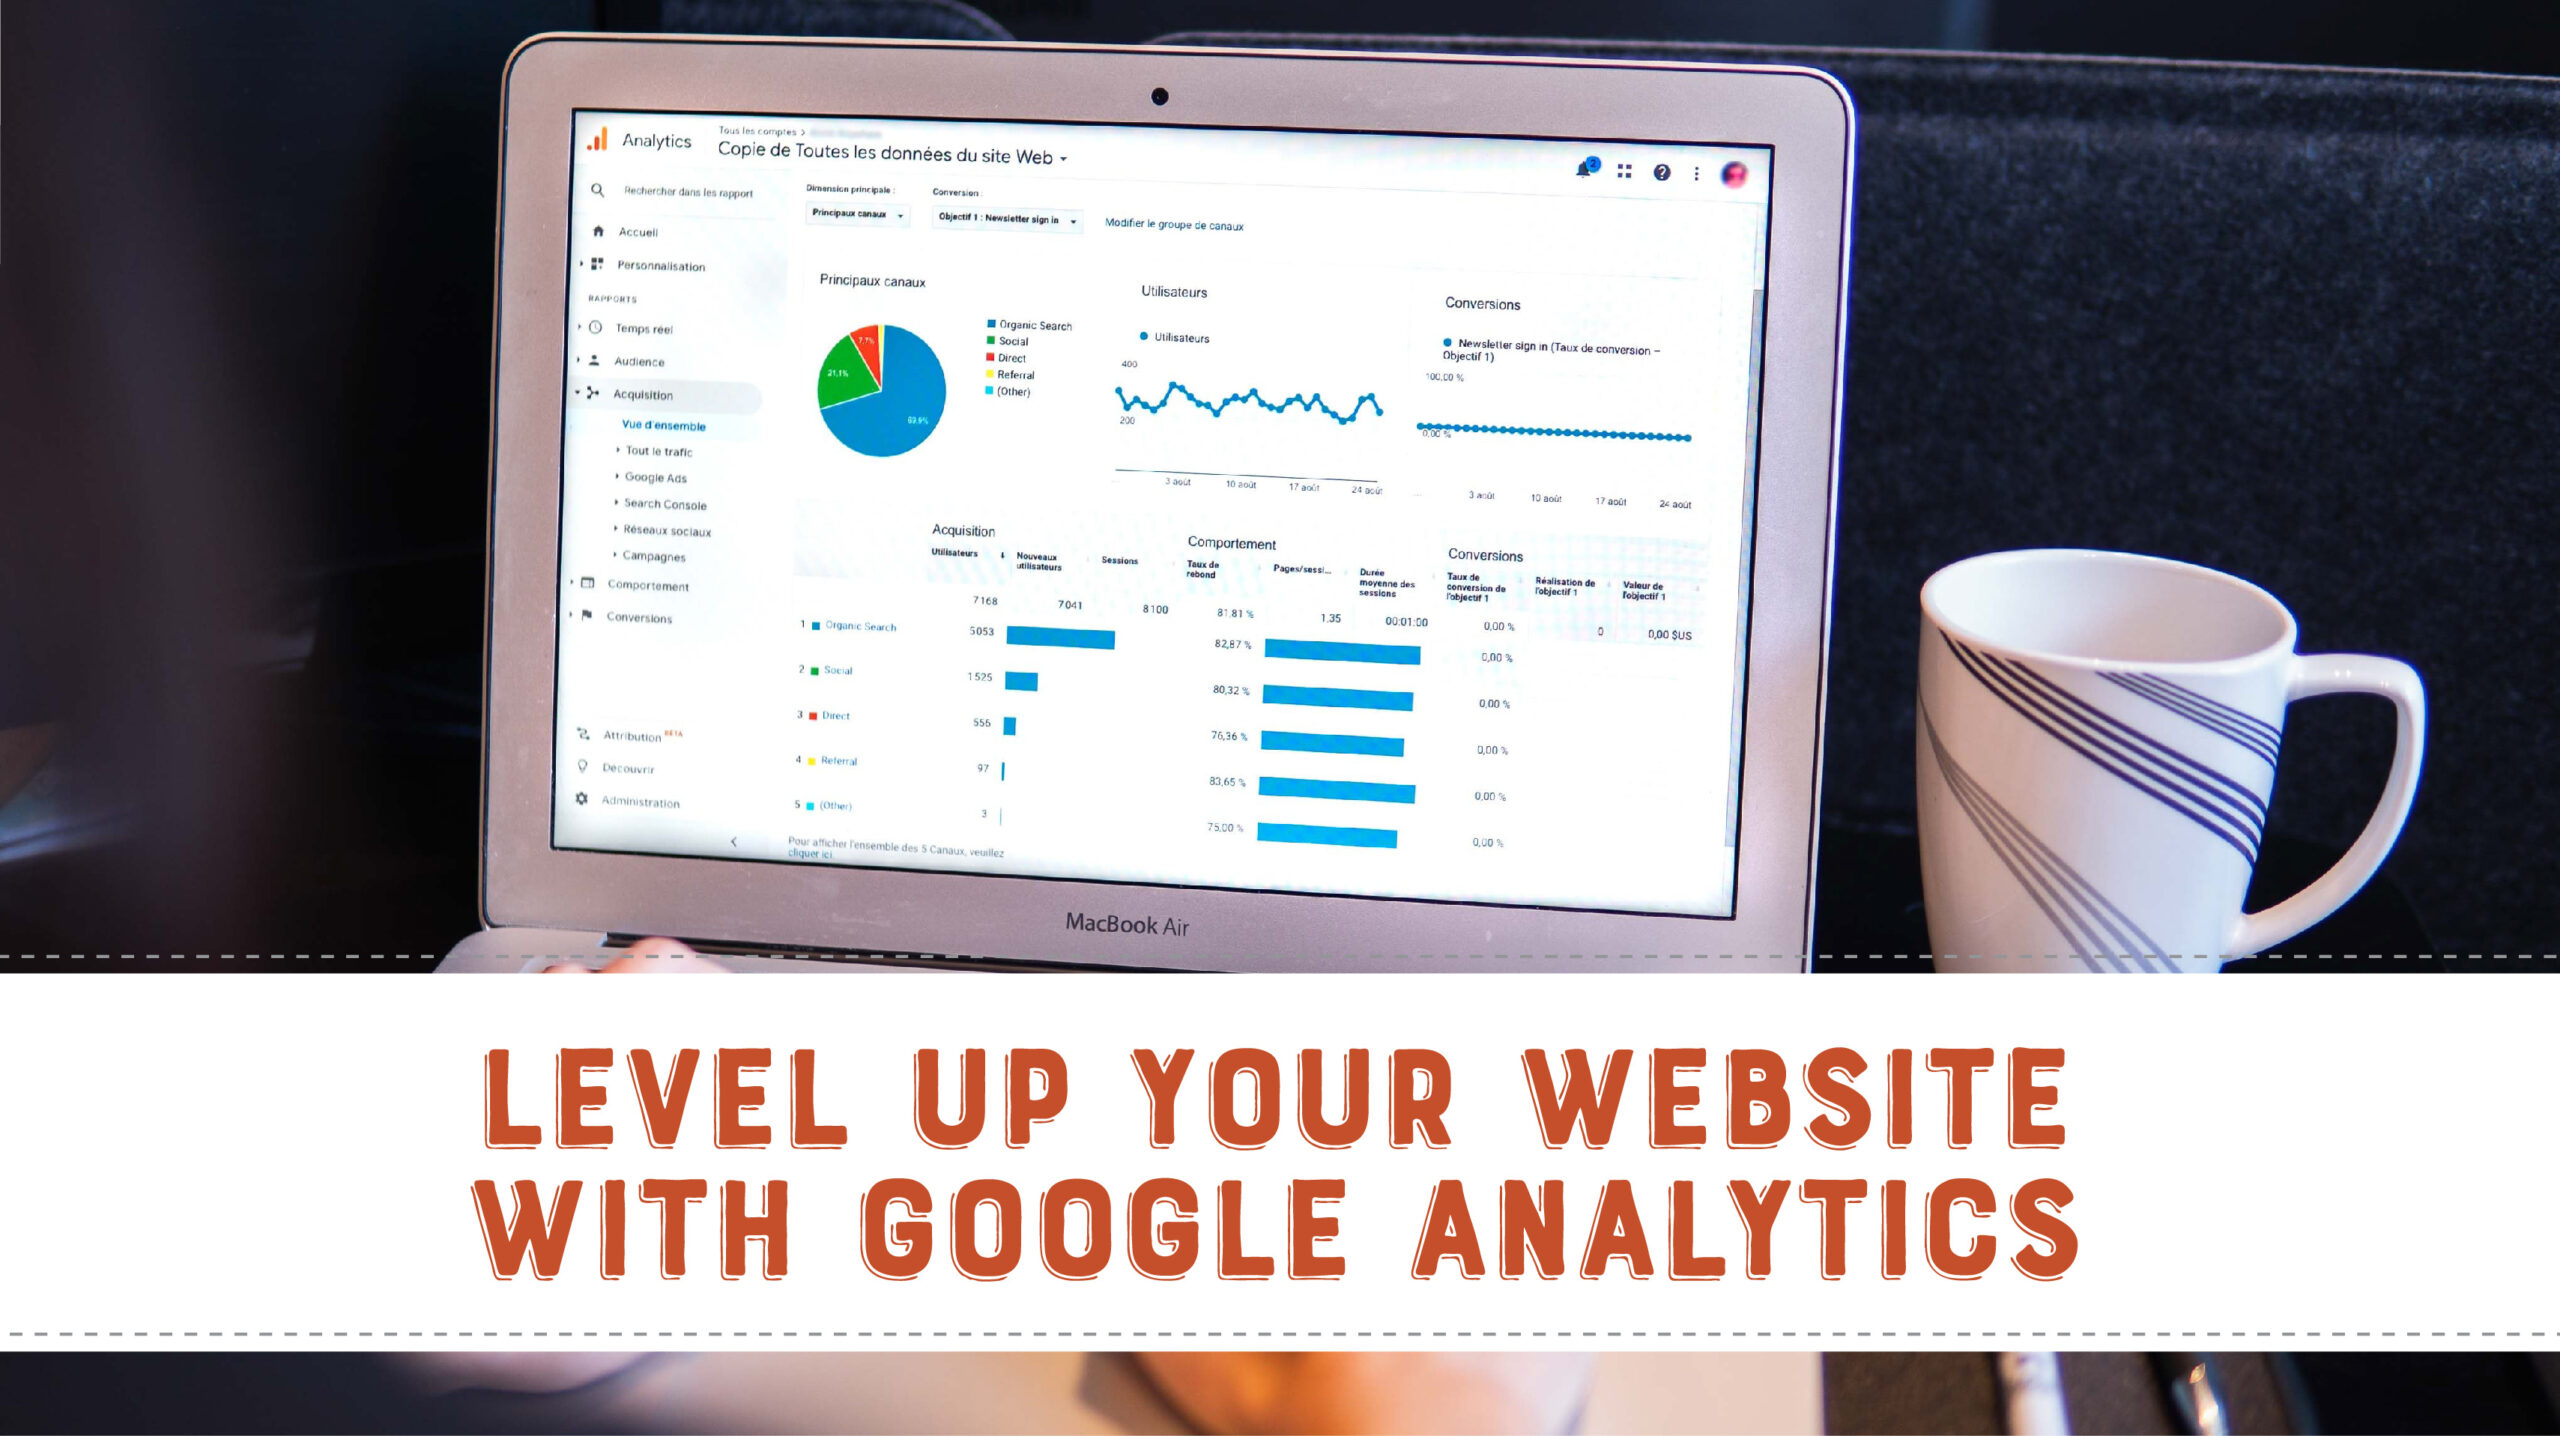
When it comes to websites, we can’t preach the importance of making sure you have Google Analytics installed on your website enough. This useful tool can give you lots of information about how visitors interact with your website and that information can serve as a great guide to help you take your website to the next level so it serves as a valuable resource for your audience. Whether your website is brand new or it’s been around for a while and you know changes are in order, Google Analytics can help you level up so you’re standing out from the crowd.
What is Google Analytics?
Google Analytics is a free tool offered by Google that helps you analyze your website traffic and gain a better understanding of your website visitors so you can evaluate the performance of your marketing, content, products, and more. Aside from the fact that Google Analytics is FREE, we recommend this tool because it’s easy to set up and provides you with plenty of data to see what is going on with your brand and how your audience is interacting with the content you post on your website, and in turn, you can use this information to take the steps necessary to improve your visitors’ experiences with your website as you learn what’s working and what’s not, where people are spending their time when they come to your site, and more.
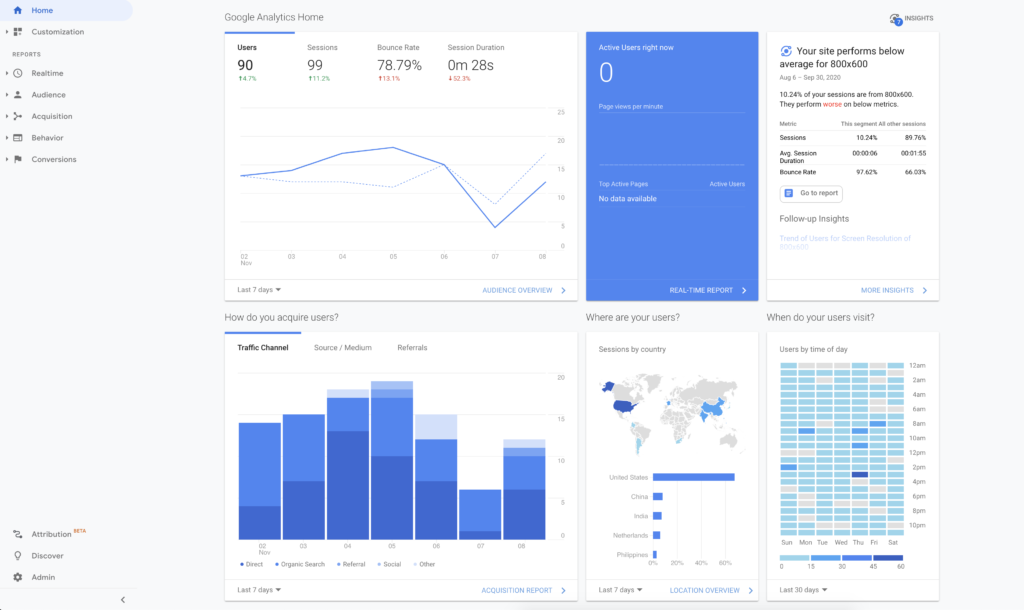
Google Analytics is a Lot Like a Lab Report
Now the first time you login to Google Analytics, it can feel a lot like getting a lab report back from your doctor. Your lab report may include lots of numbers or even graphs, charts, or percentages, and you might feel like you’re not sure if you are healthy or dying.
Similarly, there are a lot of numbers and details in Google Analytics that can leave you feeling overwhelmed when you login the first few times, but this information is important because (much like what your lab report reveals about your health), any marketing effort you do will reflect on your website. Even if you’re not driving people to your website, they will go check it out. And if your site is hard to navigate or confusing, they won’t hang around (leaving it looking a little unhealthy). On the other hand, if your messaging and calls to action are clear, people will spend time on your site and as Google Analytics collects this information, you’ll have the data you need to guide your next steps, especially if something goes wrong later on down the road.
The Critical Data You Need from Google Analytics
As we’ve mentioned, Google Analytics collects a LOT of data, so it can be hard to know what information you NEED versus the information it would be nice to look at. If you don’t look at anything else, looking at the following numbers will make checking in easier and let you know what is critical, so let’s take a look at each of these in greater depth.

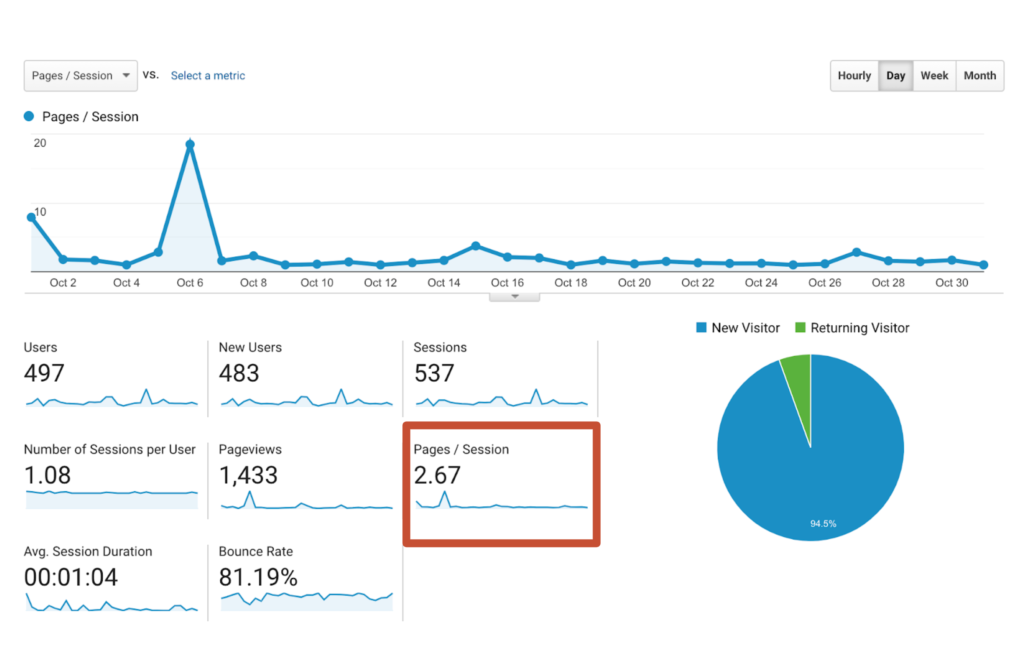
New Users: New users are people who visit your website for the very first time in a given time period. This number tells us how many people are “first-timers” to your website at any point in time, meaning they’ve never visited your website before.
New Users are kind of like tourists visiting a new place, but sometimes they love where they visited and come back which leads us to…
Users: A user is a person that visits your website. The number of users tells us how many people visit your website in a given period of time. Each user can visit your website more than once, which can be classified as separate visits.
Users are like regulars + tourists AND all the repeat visitors. You have your locals who keep coming back and the one-and-done visitors.

Sessions: A session is the period of time a visitor is actively engaged with your website and all usage data (screen views, events, transactions, etc.) that are associated with the session. Essentially, it’s any visit to your website where visitors look at more than one page, as well as your events, make a transaction, or any other kind of interaction.
To put this into perspective, think about the last time you ordered a pizza from your favorite restaurant. Your session started the moment you landed on the website. Every menu page you looked at and any purchase you made while on the site is included in that one session.
It’s important to note that Google Analytics’ default session timeout is 30 minutes, which means if someone comes to your website but is inactive for more than 30 minutes, a new session will be recorded when they take another action on your site. In addition to sessions timing out after 30 minutes of inactivity, Google Analytics sessions end at midnight (so if you were doing some late night shopping that extended past midnight, you’d be counted for two sessions), as well as if there is a change in a campaign like Google AdWords that brought a visitor to your site from one paid keyword, but then later they visited the site through a different campaign.

Number of Sessions per User: This is the average number of sessions per visitor during a given time frame. (i.e. if your audience orders pizza from your website every Friday and you are looking at your website traffic for the month, you would have four sessions per user).
Pageviews: Pageviews refers to the total number of pages viewed on your site during a given session or time period. Repeated views of a single page are counted within this number. It’s similar to when you go shopping for new shoes — the number of shoes you tried on is your pageviews.
Pages / Session: The number of pages per session is the average number of pages viewed during a session on your site and includes repeated views of a single page. Pages per session is also referred to as Average Page Depth.
So if you’re still shoe shopping, the pages per session is the number of shoes you tried on per store you visited.

Average Session Duration: Average session duration is exactly what it appears to be – the average length of time visitors are spending on your site. It’s calculated by dividing the total time spent on the site by the total amount of users. Still sticking with that shoe shopping scenario, the amount of time you spend in the store is your session duration.
Bounce Rate: Your bounce rate is the percentage of single-page sessions in which the visitor did not interact with the page. So, for example, this could be a visitor who typed your website’s URL into their browser by mistake and immediately closed the window when they landed on your site. However, in some instances you may get bounces simply because someone came to your website to look for information like your phone number and that is totally okay. Bounced sessions have a duration of 0 seconds.
Let’s say you decide to go to another store to look for shoes but as soon as you walk in you realize it’s a furniture store and immediately turn around and walk out. You entered, but bounced right out.
Month over Month vs. Year Over Year: While we’re talking about the critical data you should look at, we also want to mention the ways you can compare data. You can set custom ranges, which is especially helpful if you’re looking at how specific campaigns might compare to one another. The defaults in Google Analytics are to compare to the previous period or to the previous year. When we look at data, we typically look at it month over month and then year over year.
Looking at things year over year typically gives you a more accurate view of seasonal patterns, as well as tell you whether more traffic is coming to your site (and if not, help you spot the reason why), and accounts for similar outside factors when comparing larger datasets.

It is worth noting that year over year data is typically more accurate than month over month. For example, if you run a retail business your website stats may look drastically different from October to November as holiday season shopping begins, and especially if you run a campaign each year to advertise your Cyber Monday specials. However, comparing the period of your Cyber Monday campaign in 2018 and 2019 can help you see whether your efforts helped generate the traffic and conversions you wanted so you can make adjustments to your strategy for 2020.
Acquisition, Behavior & Conversion

Yes, there are ABCs to Google Analytics. The first is Acquisition, which refers to how a visitor arrived at your website. Acquisition metrics help you understand how people are finding you and can help you determine any adjustments you need to make to your strategy so you can continue drawing in visitors. Common acquisition channels include search engines, social media platforms like Facebook, referrals from other websites that have linked to your site, paid search such as Google Ads, and email, among others.
Behavior reports in Google Analytics help you understand what visitors do once they reach your website and where they are spending their time, including which pages they visit and any actions they take on your website. Two items within the Behavior reports you should pay attention to are Pages and Behavior Flow.
The Pages report, found under Site Content, gives you a quick look at the top pages on your website based on traffic, pageviews, unique pageviews, average time on page, entrances, bounce rate, percent exist, and page value (the Transaction Revenue + Total Goal Value divided by Unique Pageviews for the page or set of pages). The pages report helps you understand the types of content your audience is interested in, which will help you build out future content strategies for website updates and improvements.
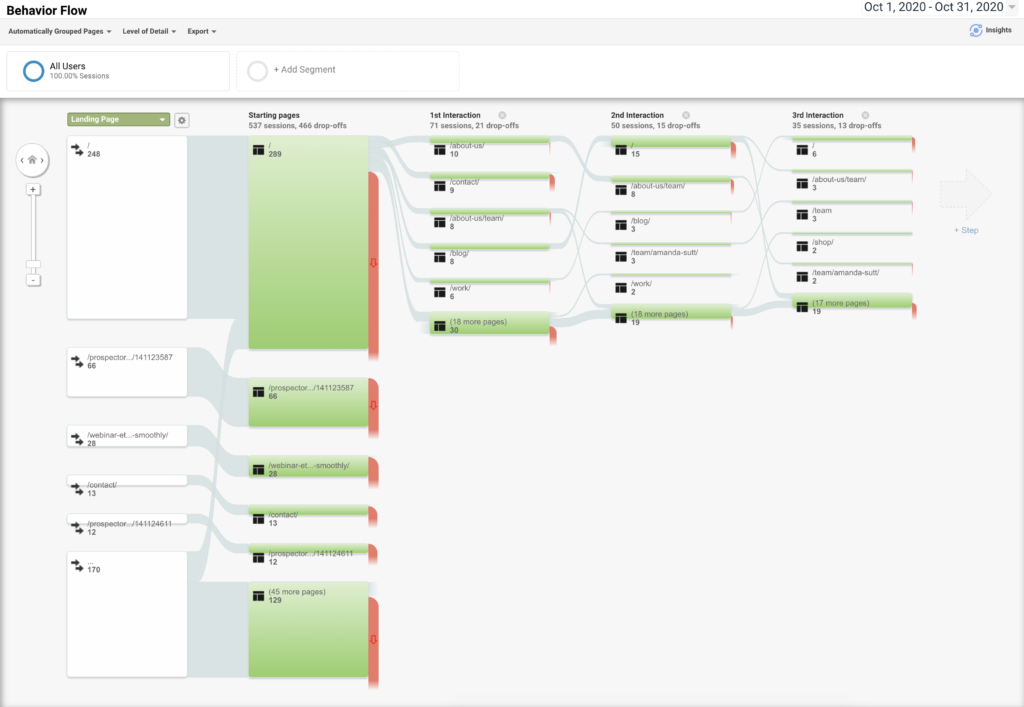
The Behavior Flow report provides a visual breakdown of the paths visitors commonly take on your website from the first page they land on to the last page they see before they leave your site. From this report, you can quickly spot areas where you may need to make improvements to keep visitors around longer or provide clearer calls to action.
The C is for Conversion, which is any activity completed on or offline that is important in regard to your business’ success. This could include a completed sign up form for a newsletter (which would be a Goal conversion) or a purchase (which is considered a transaction and sometimes referred to as an eCommerce conversion). Conversion is vital because you can track new marketing efforts to see what is working and worth keeping or moving on with.
Oftentimes, conversions are classified as macro conversions, which are usually completed purchase transactions, whereas micro conversions are completed activities like email signups, which indicate a user is interested and may want to make a purchase (macro conversion) in the future.
How Can You Tell It’s Working?
Before you can determine if your efforts are working, you need to determine what success looks like and your goals for the period (month, quarter, year, etc.). Once you have that set, you’ll know when to pull reporting and can then look at the measurements and begin adjusting as needed. Before we dive too deeply into that, let’s have a quick refresher on how to set your goals.
Set S.M.A.R.T.E.R. Goals
We are big fans of Michael Hyatt’s S.M.A.R.T.E.R. goals, which adds a few steps on to the S.M.A.R.T. method of goal setting to help you improve your chances of reaching your goals. When setting S.M.A.R.T.E.R. goals, you’re looking to see if each goal is:

Check Your Progress Monthly
When you have your goals in place, you need to set monthly check-ins so you can see how your efforts are progressing and where you might need to make adjustments in order to stay on track toward your goals. For example, you may need to spend more time optimizing your website for search engines, creating a link building strategy so you’re attracting visitors from new places, or clarifying your calls to action so visitors will complete the action you want them to take.
Prioritize!

Once you know the areas of your website that need improvement, you need to set your priorities and determine what is critical (the things that need to be done ASAP) versus what improvements may be helpful, but aren’t 100% necessary right now. Plan out when you’ll make your updates and how much time you can allocate to each needed task. Then, delegate the tasks as needed and set deadlines for when the work needs to be completed so that you can keep a pulse on the health of your website.
What Next?
Much like a lab report can help you understand how to take a more proactive approach to your own health, the same can be said for using Google Analytics to understand the health of your website and help you pivot faster when you notice something is starting to slip.
With a better understanding of what some of the data Google Analytics collects from your website, you’re better equipped to start using that data to create a better experience for your visitors, get a leg up on the competition, and have your website start truly working for your business.
If you’d like some support to get started, we can help! Fill out the form on our contact page to request a marketing consultation.

